
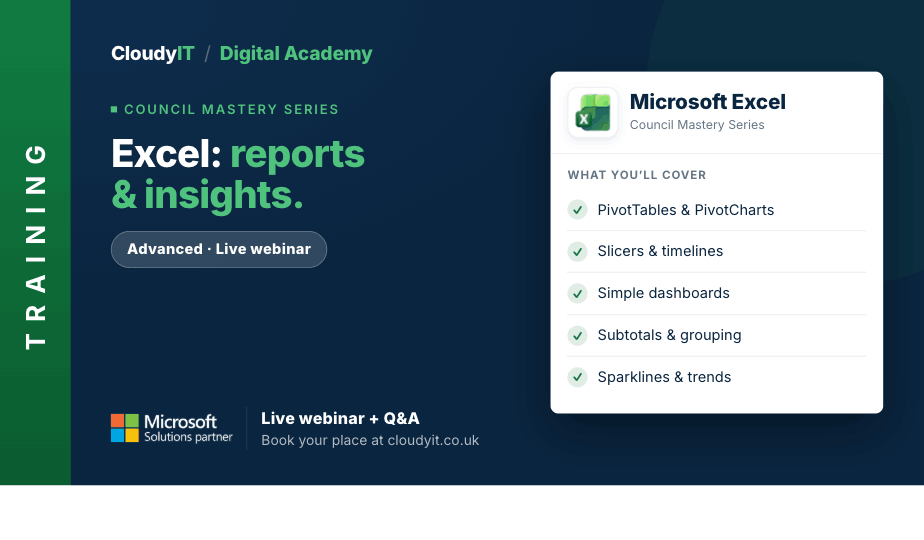
Excel – Reports & Insights
Overview:
Learn how to turn spreadsheet data into clear, useful reports that are easier to analyse and share with others. This session focuses on the Excel tools that help you highlight trends, organise information and present your findings in a professional and visually effective way. It also introduces how Copilot can support analysis, identify patterns, and suggest clearer ways to present insights.
Key Topics:
- Working with PivotTables to summarise and analyse data quickly
- Creating PivotCharts to present information visually
- Using slicers and timelines to filter reports dynamically
- Building simple dashboards to display key figures clearly
- Applying subtotals, grouping and outlining to organise data
- Using advanced filtering, custom filters and removing duplicates to prepare data for reporting
- Preparing spreadsheets for printing and presenting outputs professionally
- Using sparklines and visual tools to make trends easier to spot
- Linking worksheets and workbooks to pull data together
- Consolidating data from multiple ranges or sheets
- Using Copilot AI in Excel to support analysis and reporting
The scenarios below highlight how Excel can help turn council data into clearer reports, visual summaries, and more useful insights.
Scenarios:
1. A deputy clerk is asked to produce a quarterly services report showing trends in allotment income, hall bookings, and outstanding actions from council projects.
2. PivotTables are used to summarise raw data into a clearer report for councillors.
3. Charts, slicers, and dashboards help turn figures into a more visual and usable report.
4. Worksheets and workbooks need to be linked so information can be pulled together accurately.
5. Filtering and grouping tools are needed to organise information before it is presented.
6. Copilot helps identify patterns and suggest better ways to present the findings.
Who Should Attend:
Best suited to learners who already feel comfortable entering data, using simple formulas and navigating worksheets, and now want to improve accuracy and confidence when working with functions. Ideal for those who have attended Excel Essentials or have equivalent experience.
Pricing:
- Free for CloudyIT customers using a training credit
- £65 for non-CloudyIT customers (read T&Cs)
Continue Your Digital Learning Journey:
Take the next step with Excel Smarter Tools and Data Management to work across multiple sheets and files, test different outcomes, and gain greater control over how data is prepared, linked, and protected. It is the natural next stage for delegates who want to move from reporting and dashboards into more advanced analysis and workbook management.
Keep Building Your Digital Confidence:
- Try the Microsoft 365 Digital Skills Audit Tool
- Join an AI in Local Government Members’ Day
- Come along to a DisGovery Day in person